
LIMS operational analytics reporting setup is defined as the process of connecting your laboratory information management system to a structured analytics and reporting layer that delivers real-time, actionable performance data. For genetic and molecular diagnostic labs, this is not optional infrastructure. The volume, complexity, and clinical sensitivity of genomic data make ad hoc reporting dangerous. A well-configured setup tracks turnaround times, instrument utilization, reagent consumption, and workflow bottlenecks in one place. Platforms like Labrynix are built specifically for this context, combining LIMS workflow management with AI-powered operational visibility from the start.
What prerequisites and tools are essential for LIMS operational analytics reporting setup?
API-first integration and open, well-governed data schemas are the two non-negotiable prerequisites for any successful analytics setup. Without them, your reporting layer cannot access live data, and every insight you generate is already stale. API readiness and open data access in LIMS selection future-proofs lab analytics and supports scalable AI integration. That single architectural decision determines whether your analytics layer can grow with your lab or becomes a bottleneck within two years.
The underlying data model must be clean and consistent before you configure a single dashboard. Garbage data produces garbage reports, and in a molecular diagnostic lab, a misleading turnaround time report can mask a real quality problem. Labs should audit their sample tracking records, instrument calibration logs, and order intake fields before activating any reporting module. This audit is not a one-time task. It becomes a recurring validation checkpoint.

The table below outlines the core tools and systems a lab needs to prepare before configuring the analytics layer.
| Component | Purpose | Example |
|---|---|---|
| API gateway | Connects LIMS to external analytics platforms | HL7, FHIR, REST APIs |
| Open data schema | Enables near-real-time data streaming | Structured JSON exports |
| Data validation rules | Prevents dirty data from entering reports | Field-level constraints in LIMS |
| Instrument interfaces | Feeds equipment data into the analytics layer | LIMS instrument integration |
| Role-based access controls | Governs who sees which reports | HIPAA-aligned permission tiers |
Key prerequisites to confirm before configuration begins:
- LIMS vendor supports open API access without data export fees
- Sample and patient records follow a consistent naming and field convention
- Instrument data flows into LIMS automatically, not through manual entry
- Your team has identified the five to eight KPIs that matter most operationally
- Compliance requirements (FDA 21 CFR Part 11, ISO 15189) are mapped to specific report fields
Pro Tip: Ask your LIMS vendor directly whether data streaming is included in your license or priced separately. Proprietary data lock-in is the single biggest source of technical debt in lab analytics programs, and the conversation is easier before you sign than after.
How to configure the LIMS analytics layer and reporting modules effectively?
Generic BI tools often fail in labs because they lack the domain-specific context needed to interpret lab data relationships. A standard business intelligence platform does not know that a reagent par level breach at 3 a.m. is more urgent than a delayed invoice. A specialized analytics layer built for laboratory workflows understands those relationships and can trigger the right alert to the right person.
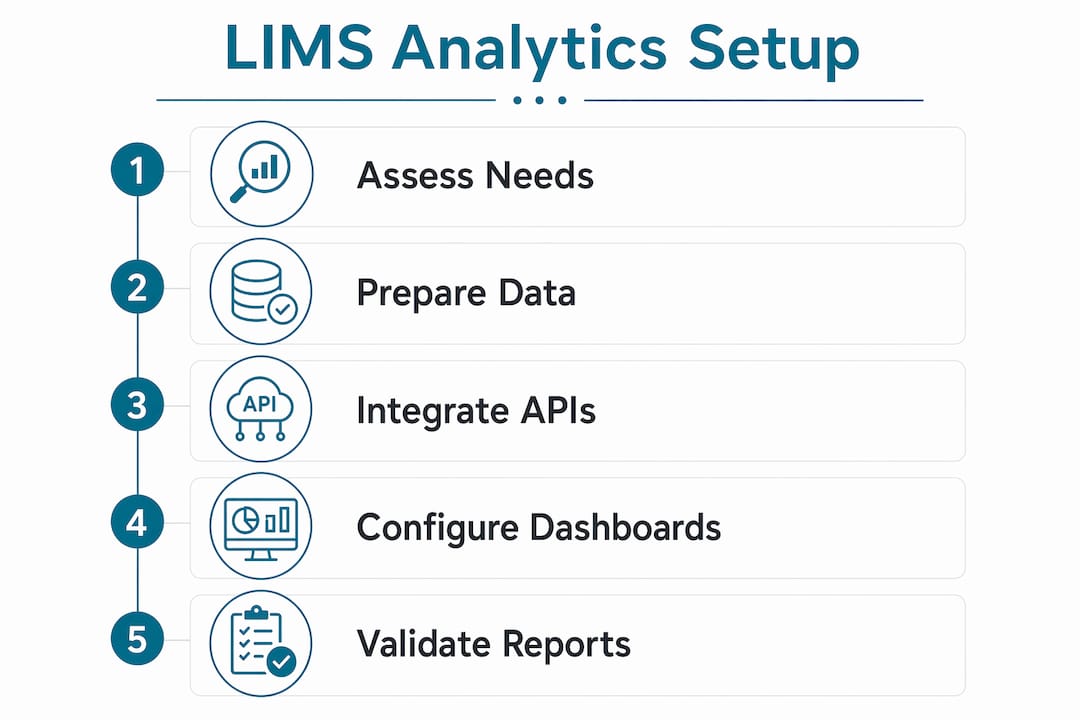
Configuration follows a logical sequence. Skipping steps creates reporting gaps that are difficult to trace later.
- Connect your data source. Link the LIMS database to the analytics layer using your API gateway. Confirm that sample status, order data, and instrument readings are flowing in near real time.
- Define your data model. Map fields from LIMS to the analytics schema. Confirm that turnaround time, throughput rate, and work-in-progress counts are calculated consistently.
- Build your dashboard templates. Configurable dashboards display critical lab performance metrics including turnaround times, throughput rates, and work-in-progress counts. Start with three to five views: daily throughput, pending review queue, and instrument utilization.
- Set threshold-based alerts. Define the numeric boundaries that trigger a notification. For example, flag any sample that exceeds 48 hours in accessioning without a status update.
- Schedule automated report delivery. Automated report delivery by email or messaging with threshold alerts helps labs detect issues faster and reduce manual effort. Set daily summaries for lab managers and weekly trend reports for directors.
- Validate outputs against known data. Run the first week of reports against manually verified records. Confirm that calculated KPIs match what your team observes on the floor.
Typical KPIs for a molecular diagnostic lab analytics dashboard include:
- Sample-to-result turnaround time by test type
- Instrument uptime and utilization percentage
- Reagent consumption versus projected usage
- Review queue age and pending report count
- Order rejection and rerun rates
Pro Tip: Involve at least one bench scientist and one lab manager in the dashboard design session. They will identify missing fields and misleading metrics before the system goes live, saving weeks of reconfiguration.
What best practices ensure data quality in LIMS analytics reporting?
A phased rollout is the most reliable path to trustworthy analytics data. Starting with core LIMS functions before advanced analytics ensures workflow adaptation and data reliability. Specifically, begin with sample management and workflow standardization. Clean, reliable data at that layer is the foundation for every report you will ever generate.
Map your standard operating procedures to specific LIMS fields before you write a single report template. If your SOP says instrument calibration must be logged within one hour of completion, that timestamp field must be required in LIMS. If it is optional, analysts will find gaps in calibration reports and spend hours investigating data entry failures instead of real quality issues.
Reporting templates should include compliance documentation and audit trails to meet standards such as FDA 21 CFR Part 11 and ISO 15189. This is not just a regulatory checkbox. Audit trails are also your best diagnostic tool when a report produces an unexpected result. You can trace exactly which data point changed, when, and by whom.
Ongoing validation and audit-readiness checks to run on a recurring schedule:
- Verify that all required LIMS fields have completion rates above 98%
- Confirm that instrument data feeds have not dropped or delayed in the past 24 hours
- Review threshold alert logs to confirm alerts fired correctly against known events
- Check that report templates reflect the current version of your SOPs
- Run a monthly data reconciliation between LIMS records and your LIS or EHR outputs
- Confirm role-based access logs show no unauthorized report access
Labs that treat data integration as a priority avoid the costly rebuilds that come from locked schemas and delayed data streaming. The labs that skip this discipline spend their analytics budget on fixing data problems instead of generating insights.
How to troubleshoot common issues in LIMS analytics reporting?
Integration failures are the most frequent obstacle in a LIMS analytics reporting setup. They usually trace back to one of three causes: API authentication errors, schema mismatches between LIMS and the analytics layer, or network latency that breaks near-real-time data feeds. Start troubleshooting by checking API logs before assuming the problem is in the reporting module itself.
Data inconsistency is the second most common issue. It appears when the same metric is calculated differently in two places, for example, turnaround time measured from accessioning in one report and from order receipt in another. Resolve this by defining each KPI in a single, documented formula and enforcing it across all report templates. Reusable templates with consistent formulas save time and improve accuracy for labs with high turnaround requirements.
Slow report generation usually signals a query design problem, not a hardware problem. Large, unindexed data pulls across years of records will always run slowly. Work with your analytics layer vendor to add appropriate indexes and limit default report windows to 30 or 90 days, with on-demand access to historical data.
Common issues and their fixes:
- API authentication failures: Rotate credentials and confirm IP allowlisting with your LIMS vendor
- Schema mismatches: Document field mappings in a central data dictionary and update it with every LIMS upgrade
- Slow report generation: Add query indexes and narrow default date ranges
- Missing instrument data: Audit the instrument interface setup for dropped connections or firmware incompatibilities
- Alert fatigue: Recalibrate threshold values quarterly based on actual operational patterns
Pro Tip: Build a shared troubleshooting log that your IT team and lab analysts both contribute to. The fastest resolution usually comes from combining the analyst's knowledge of what the data should look like with the IT team's knowledge of where the data comes from.
Scalability planning belongs in the initial setup, not as an afterthought. Labs that add new test panels, instruments, or locations without updating their data model accumulate technical debt quickly. Review your analytics architecture every six months and confirm it still reflects your actual workflow.
Key Takeaways
A successful LIMS operational analytics reporting setup requires API-first integration, a clean data model, a lab-specific analytics layer, and a phased rollout that starts with core workflow standardization before advancing to complex reporting.
| Point | Details |
|---|---|
| API-first architecture is mandatory | Open APIs and accessible schemas are the foundation for real-time lab analytics. |
| Specialized analytics layers outperform generic BI | Lab-specific context is required to generate meaningful alerts and accurate KPIs. |
| Phased rollout protects data quality | Start with sample management before activating advanced reporting modules. |
| Compliance templates reduce audit risk | FDA 21 CFR Part 11 and ISO 15189 requirements must be built into report templates from day one. |
| Troubleshooting starts at the API layer | Most reporting failures trace back to integration or schema issues, not the reporting module itself. |
The analytics layer is the part most labs get wrong
I have seen labs spend months selecting a LIMS, negotiate hard on pricing, and then treat the analytics configuration as a post-go-live task someone will handle eventually. That decision costs them more than the original implementation. The reporting layer is where the value of a LIMS actually shows up for lab managers and directors. Without it, you have a very expensive sample tracking spreadsheet.
The insight that changed how I think about this: domain-specific understanding of concepts like reagent par levels and instrument rolling averages is what separates a useful analytics layer from a generic dashboard. A generic dashboard shows you numbers. A lab-specific analytics layer tells you when a number means something is about to go wrong.
The compliance angle also gets underestimated. Labs configure beautiful dashboards and then discover during an audit that their report templates do not capture the audit trail fields required by FDA 21 CFR Part 11. Retrofitting compliance into a reporting system is painful. Building it in from the start takes an extra day of configuration and saves weeks of remediation.
My honest recommendation: treat your analytics setup as a clinical workflow, not an IT project. Assign a lab manager as the analytics owner, not just an IT administrator. That person knows what the data should look like. They will catch problems that no automated validation rule will ever find.
— Tarek
How Labrynix supports genetic and molecular lab analytics
Labrynix is built for exactly the operational context this article describes. The platform connects LIMS workflow management with AI-powered analytics through Labrynix Intelligence, which supports bottleneck detection, review queue management, and lab performance visibility in one connected system.
Labrynix Connect supports HL7, FHIR, REST APIs, and webhooks, giving your analytics layer the open data access it needs without proprietary lock-in. Reporting templates in Labrynix are customizable for compliance documentation, PGx report delivery, and molecular diagnostic lab workflows. Role-based access, audit logs, and configurable permissions are built into the platform from the ground up. If your lab is ready to move from disconnected reporting tools to a purpose-built analytics environment, Labrynix gives you the infrastructure to do it without rebuilding your workflows from scratch.
FAQ
What is LIMS operational analytics reporting setup?
LIMS operational analytics reporting setup is the process of connecting a laboratory information management system to a structured analytics and reporting layer that delivers real-time performance data. It covers data integration, dashboard configuration, KPI definition, and automated report delivery.
Why do generic BI tools fail in lab analytics?
Generic BI tools lack domain-specific context for lab data relationships, such as reagent par levels or instrument rolling averages. A specialized analytics layer built for laboratory workflows generates more accurate alerts and meaningful reports.
What KPIs should a molecular lab track in its analytics dashboard?
The core KPIs for a molecular diagnostic lab include sample-to-result turnaround time, instrument utilization, reagent consumption versus projected usage, review queue age, and order rejection rates.
How does a phased rollout improve analytics data quality?
Starting with core LIMS functions like sample management and workflow standardization produces clean, consistent data before advanced analytics are activated. This prevents dirty data from corrupting reports and reduces reconfiguration time after go-live.
What compliance standards apply to LIMS reporting templates?
FDA 21 CFR Part 11 and ISO 15189 are the primary standards that govern LIMS reporting templates in clinical and molecular diagnostic labs. Templates must include audit trails and compliance documentation to meet these requirements during regulatory review.